Year on Year analysis
This section shows you how students' performance has changed over a year.
Same Batch
The performance of students in class this year is compared to the performance of the same batch of students in their
class in the previous year.
(Note: The analysis may not be valid if the number of students in the batch has changed significantly in the past two years.)
class in the previous year.
(Note: The analysis may not be valid if the number of students in the batch has changed significantly in the past two years.)
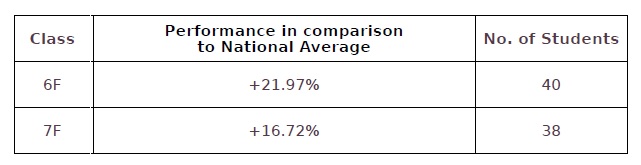
Your students in class 7 F have not improved in the average performance in English from last year.
Previous batch
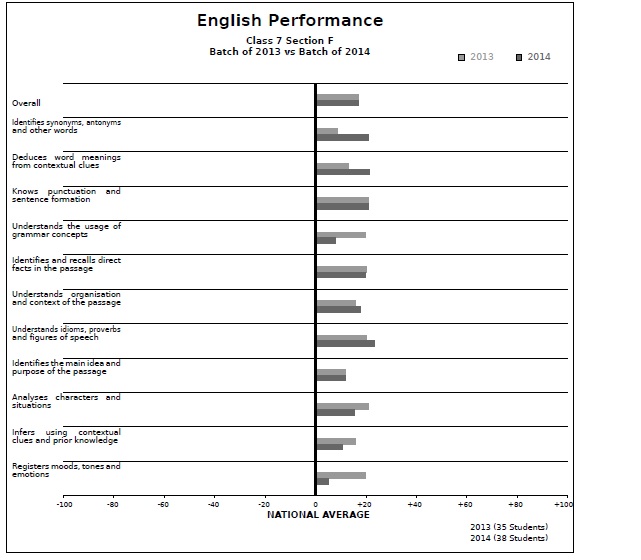
The following graph compares the performance of your current batch of students against the previous batch. The horizontal bars in the graph show how students of your class have fared against the national average in each skill across two years.
The thick black vertical line in the centre marks the national average.
For example, a bar towards the right would mean that students performed higher than the national average that year in the particular skill
The thick black vertical line in the centre marks the national average.
For example, a bar towards the right would mean that students performed higher than the national average that year in the particular skill